Đối với phần IELTS Writing Task 1, bạn chỉ có vỏn vẹn 20 phút để hoàn thành nên hãy thành thục mọi bước viết bài nhanh gọn nhất đặc biệt là phần mở bài để đảm bảo "Đầu xuôi, đuôi lọt".
IELTS SUCCESS sẽ cùng bạn lưu lại những bí kíp để có thể viết phần mở bài cho phần Task 1 "nhẹ như lông hồng" mà vẫn ăn điểm cao.
Hãy xem ví dụ về một mở bài tốt cho IELTS Writing task 1.
Đề bài:
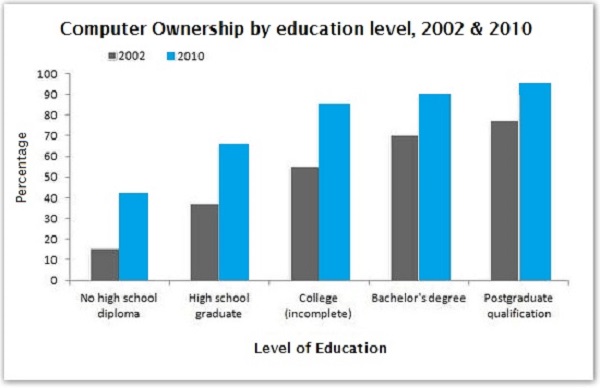
The graphs below give information about computer ownership as a percentage of the population between 2002 and 2010, and by the level of education for the years 2002 and 2010.
Mở bài:
The bar charts show data about computer ownership, with a further classification by level of education, from 2002 to 2010.
Để có thể viết một mở bài tốt mà nhanh nhất, bạn hãy làm theo các bước sau:
1. Thay thế lại các cụm từ diễn giải về biểu đồ
- the graph/chart/table/diagram
- gives information about/on
- provides information about/on
- shows
- illustrates
- represents
- depicts
- gives reason why (nếu biểu đồ giải thích lý do cho vấn đề gì đó)
- explains why (nếu biểu đồ giải thích lý do cho vấn đề gì đó)
-compares (nếu có sự so sánh giữa hai hoặc nhiều đối tượng trở lên)
Cần lưu ý với cách sử dụng cấu trúc với động từ compare:
-compares smth in terms of smth: so sánh đối tượng nào đó về khía cạnh gì
The charts compare two cities in terms of the number of employed people.
- compares smth in year 1 and year 2: so sánh đối tượng nào đó trong các năm khác nhau
The graph compares the population in 2000 and 2013.
Ví dụ:
-The pie charts provide information on the proportion of males and females working in the agricultural sector.
Hoặc:
-The pie charts show the proportion of males and females working in the agricultural sector.
-The table compares five companies in terms of the number of employees
Hoặc
-The table illustrates the number of employees in five companies.
2. Thay đổi lại cấu trúc ngữ pháp của câu trong đề bài
|
Câu trong đề bài |
Câu viết lại trong mở bài dùng mệnh đề quan hệ |
|
- shows the number of people - depicts changes in spending on |
- shows how many people - depicts how much changed spending on |
Bạn cũng có thể sử dụng các từ đồng nghĩa để thay thế
- numberof = quantity of (không được thay thế bằng amount of)
- spending = expenditure
- rate = percentage
- ratio = proportion
- information = data
- change =increase, decrease or variation
- share = portion
- place= site
3. Diễn đạt lại các cụm từ chỉ khoảng thời gian
- from1985 to 1995 = between 1985 and 1995
- in 1985 = in the year 1985
- in1985 and 1995 = in 1985 and 1995 respectively = in the years 1985 and 1995
Ví dụ:
-The table shows consumption rates from 2001 to 2004.
-The graph shows consumption rates in 2012 and 2015 respectively.
Ví dụ về cách viết một mở bài IELTS Writing Task 1 hoàn chỉnh:
Đề bài:
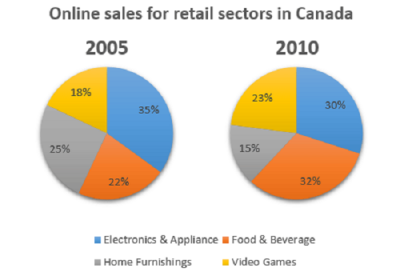
The two pie charts below show the online shopping sales for retail sectors in Canada in 2007 and 2009.
Các cụm từ cần thay thế trong mở bài:
- ThayShow bằng compare
- Thêm đơn vị Percentages
- Thêm tính từ miêu tả Different
- Chuyển cụm từ In 2007 and 2009 thành In the years 2007 and 2009
Mở bài được viết lại hoàn chỉnh:
The two pie charts compare the percentages of online shopping sales in Canada for different retail sectors in the years 2007 and 2009.
Luyện tập: hãy lựa chọn các câu đúng bên dưới